Three watershed associations in the Boston area—the Mystic River, Charles River, and Neponset River Watershed Associations—are collaborating with community volunteers and the U.S. Environmental Protection Agency (EPA) to monitor water quality and develop annual “report cards” that communicate the recreational health of the watersheds. For the first time, EPA announced report cards for all three Boston Harbor watersheds together at a joint press conference at the Deer Island Wastewater Treatment Plant in 2021. The work illustrates the communities’ and the agency’s commitment to improving the water quality of local urban rivers and the Boston Harbor into which they drain.
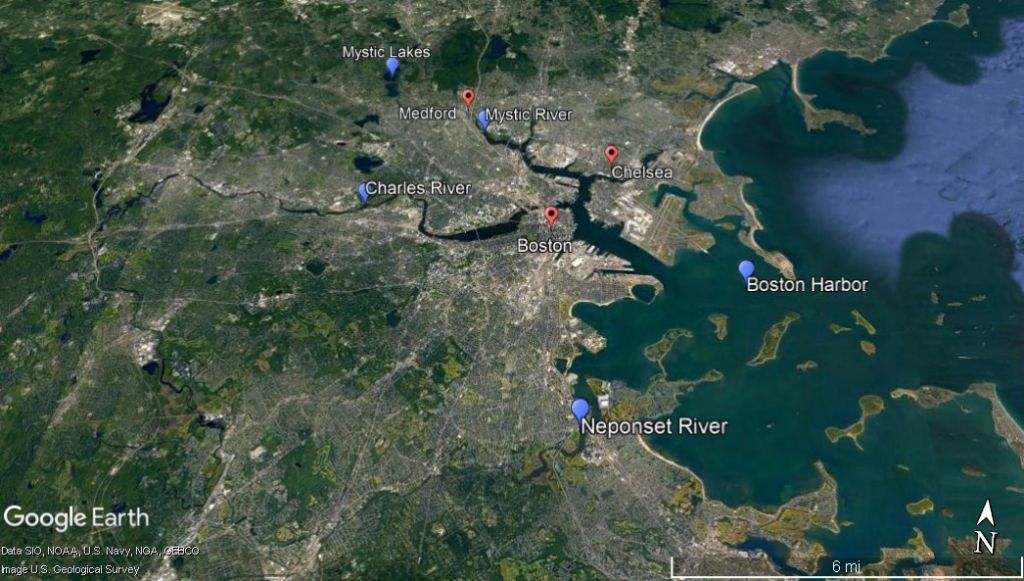
The Mystic, Charles, and Neponset Rivers flow through heavily urbanized areas and into the Boston Harbor. Map created in Google Earth.
The Watersheds
The Mystic River watershed includes 76 square miles and 21 communities in greater Boston. It includes the 7-mile long Mystic River, flowing from the Mystic Lakes in Arlington, MA through Medford, and Chelsea to the Boston Harbor. In 2007, EPA launched the Mystic River Watershed Initiative, aimed at improving water quality throughout the heavily urbanized watershed. In 2013, the Mystic became an Urban Waters Federal Partnership location that works in conjunction with the Initiative.
The Charles River is 80 miles long, winding from its source in Hopkinton, MA, through 35 Massachusetts communities, all of which have distinct land uses ranging from protected wetlands, suburban developments, to heavily urbanized Boston neighborhoods. Since 1995, the EPA has used the Charles River Report Card to measure and evaluate progress towards meeting the State of Massachusetts bacterial water quality standards for swimming and boating in the Lower Basin of the Charles River.
South of the Charles River Watershed and forming the southern boundary of Boston, the Neponset River flows 29 miles from the Neponset Reservoir in Foxborough, MA to Dorchester Bay. On its way to the ocean, the river runs through 14 cities and towns and areas of critical environmental concern, the Fowl Meadow and Ponkapoag Bog and the Neponset River Estuary. In 2020, EPA assigned the Neponset River a grade for the first time.
The Mystic and Charles watersheds are affected by combined sewer overflows, while all three are prone to stormwater pollution and the effects of climate change.
Volunteer-Based Water Quality Monitoring Networks
Organizations in each watershed have established strong and consistent volunteer-based water quality monitoring networks; these organizations also collaborate with EPA to publish river report cards using bacterial data collected by community scientists.
Water Quality Parameters and Reporting
Bacteria in water poses human health risks and safety standards for bacterial exposures are established for both swimming and boating activities. Each of the rivers in the Boston area is monitored for bacterial indicators at locations in different parts of their watershed; the results from the testing are incorporated into the overall EPA River Report Card grades. The watersheds calculate the report cards in close coordination with EPA, who publishes the grades and promotes the work. The Commonwealth of Massachusetts water quality standards for bacteria in water are:
- 235 (swimming) & 1260 (boating) E. coli per 100 ml of freshwater, and
- 104 (swimming) & 350 enterococci per 100 ml of saltwater.
Water quality samples from the Mystic, Charles, and Neponset Rivers are analyzed for E. coli during both wet and dry periods. The data is used to calculate the percentage of days that the swimming and boating standards are met. Grades are based upon the compliance with water quality standards, and they are evaluated on a three-year rolling average to account for variability in weather. Also incorporated into the Mystic River Report Card are measurements of Enterococcus, and into the Charles River Report Card are measurements of cyanobacteria (algal blooms) and combined sewer overflows, which also pose public health risks.

The Mystic, Charles, and Neponset River Watershed Associations have been actively monitoring water quality for more than 20 years in their watersheds. The Mystic Monitoring Network (MMN) started in 2000 and provides baseline water quality monitoring at 15 locations, as well as hotspot monitoring following rain events. Since 1995, the Charles River Volunteer Monthly Monitoring (VMM) program equips 80 dedicated volunteers with the training and materials to collect monthly water samples at 39 locations across the watershed. Since 1995, over 50 volunteers in Neponset River Citizen Water Monitoring Network (CWMN) collect samples at 41 sites once a month.
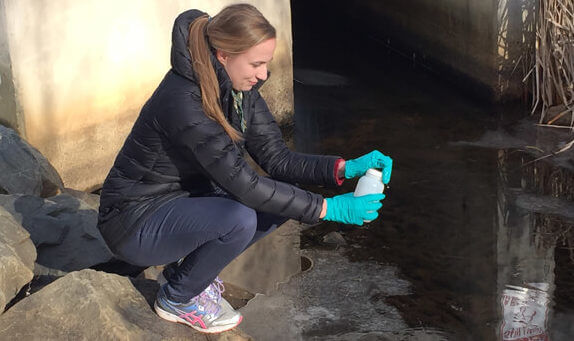
A volunteer from the Neponset River Watershed Association’s Citizen Water Monitoring Network takes a water quality sample at one of the 41 sites in the network. Photo: Neponset River Watershed Association
Powered by the data of each watershed’s volunteer monitoring networks, EPA now announces water quality grades for each watershed, based principally on bacteria concentrations. Report cards were first created for the Charles and Mystic River in 1995 and 2006, respectively. The first grades were reported for single sections in each watershed. Recently, EPA shifted to a more refined system that assigns grades to individual water bodies and segments, first in the Mystic River Report Card in 2014 and then in the Charles River Report Card in 2019. The year 2020 marked the first official EPA Neponset River Report Card. Organized like the Mystic and the Charles River reports, the information is presented by segments to provide better information about problem areas.
The work of the watershed organizations and the reporting by EPA is enabling an assessment of areas most in need of improvements and providing the community with the most accurate information for safe recreation. Pinpointing problem areas enables water agencies to target investments where they are most needed, as was the case with the Island End River, a tributary to the Mystic River where a sewage issue was found. Infrastructure investments were made, sewage inputs were reduced, and water quality grades improved in that segment from a D to an A+ grade over a 3-year period.

EPA issued river report cards for the Mystic, Charles and Neponset Rivers based on water quality data collected by community scientists working with local watershed organizations.
Partnerships are Bridging the Gap
Partnerships like these between the Mystic, Charles, and Neponset Watershed Associations and EPA bridge the gap between the work happening in the community and work happening at the federal level. While the monitoring in the three watersheds has been on-going for many years, assigning river report card grades for all three watersheds that drain to Boston Harbor is a major accomplishment that advances the overall goals of improving water quality in the Boston area. Further, pinpointing problem areas makes local infrastructure investments and improvements more effective and efficient. Cooperation between watershed organizations, community members, and EPA shows the strong commitment of each to making and keeping their local rivers healthy, safe spaces for the community to enjoy.

